Fed Fund Rates - A Historical Perspective
It is probably not a shock to anyone that we are a little bit nerdy here at Bryant & Brannock. We like math and numbers and statistics. It is fascinating stuff. Really. So, it is no surprise then that we spent much of our day today poring over data on the Federal Funds rate for the past 70 years. It was riveting.
The Federal Reserve Board convenes again next week and the world will be waiting anxiously to hear whether they will raise interest rates, keep them the same or lower them. Rates are currently at 4.83%. Economists, money managers, bankers and politicians are emphatically declaring what they think the Fed should do, but since we don’t really know what the Fed will do, let’s just focus on that number for now. From a historical perspective, is 4.83% low or high?
According to data taken from www.macrotrends.net, the average daily Fed Funds rate from July 1, 1954, to April 21, 2023, is 4.67%. That is pretty close to where we are today at 4.83%. From a 70-year perspective, the Fed Funds rate is in normal territory. However, from a recent perspective, today’s rate is markedly higher. From 2008-2022, the Fed Funds average annual rate was 0.69%. That is a huge difference. The Fed Fund rate has been historically low. We can’t find another 15-year period, prior to 2008, that is even close. The closest 15-year period we found was from 1955 to 1970 when the Fed Funds average annual rate was 3.62%. Nostalgic for the Fifties and Sixties, anyone?
The past 15 years have seen the war in Afghanistan, the Great Recession, a housing bubble, a credit crisis, a global pandemic and the war in Ukraine. The Fed kept interest rates artificially low throughout this period in order to help stimulate the economy. It was effective, but the inherent risk was that the low rates could eventually cause inflation, which showed up in a not so transitory way in 2022. There is an interesting parallel to the monetary policy of the 1950s. President Harry S. Truman was adamantly opposed to raising interest rates because he wanted to protect the American citizens who had supported the war effort against Germany by buying bonds. The rates had been set lower in 1942 at the request of the Treasury so they would have cheaper debt financing during the war. (As we saw in 2022, when bond rates increase, it hurts the market value of existing, lower yielding bonds.) However, the low interest rates stoked an inflationary environment in 1951. This led to a heated debate between President Truman and the Federal Reserve, which ultimately led to the creation of an agreement known as the Treasury-Fed Accord, which helped secure the independence of the Federal Reserve to pursue monetary policy.
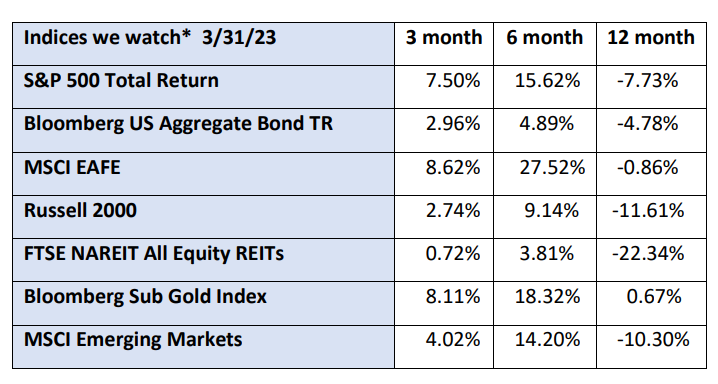
Okay, enough history. We prefer math. We have learned over time that there is a balancing act between interest rates and economic expansion. We can see that rates have been kept historically low for a long period of time. Inflation was at an 8% average in 2022. The Fed target for inflation is 2%. That number declined significantly to 5% in March. The increase in interest rates is having the desired effect on inflation, but there is more work to be done. This creates uncertainty in the markets, which do not like uncertainty. We think there will be continued volatility in the stock markets, but we don’t expect extreme volatility. We like the returns we are getting now from fixed income investments. International stocks, as measured by the MSCI EAFE index, have significantly outperformed US stocks over the past six months. There are opportunities for growth out there, but there are risks, as well. Inflation is a big concern, and the potential impact of a recession is unknown.
We believe we can mitigate some of these market risks and seek growth through our diversified approach to investing. We are cautiously optimistic for positive returns this year, but we are not expecting double digit returns overall.
*The index returns are drawn from Morningstar Advisor Workstation. Indexes are unmanaged and cannot be invested in directly by investors. MSCI EAFE NR USD-This Europe, Australasia, and Far East index is a market-capitalization-weighted index of 21 non-U.S., industrialized country indexes. S&P 500 TR USD – A market capitalization-weighted index composed of the 500 most widely held stocks whose assets and/or revenues are based in the US; it’s often used as a proxy for the stock market. TR (Total Return) indexes include daily reinvestment of dividends. Bloomberg US Agg Bond TR USD This index is composed of the BarCap Government/Credit Index, the Mortgage Backed Securities Index, and the Asset-Backed Securities Index. The returns we publish for the index are total returns, which includes the daily reinvestment of dividends. The constituents displayed for this index are from the following proxy: iShares Core US Aggregate Bond ETF. MSCI Emerging Markets IndexSM is a free float-adjusted market capitalization index that is designed to measure equity market performance in the global emerging markets. Russell 2000 – Consists of the smallest 2000 companies in the Russell 3000 Index, representing approximately 7% of the Russell 3000 total market capitalization. The returns we publish for the index are total returns, which include reinvestment of dividends. The MSCI Emerging Markets (EM) IndexSM is a free float-adjusted market capitalization index that is designed to measure equity market performance in the global emerging markets. As of May 2005 the MSCI Emerging Markets Index consisted of the following 26 emerging market country indices: Argentina, Brazil, Chile, China, Colombia, Czech Republic, Egypt, Hungary, India, Indonesia, Israel, Jordan, Korea, Malaysia, Mexico, Morocco, Pakistan, Peru, Philippines, Poland, Russia, South Africa, Taiwan, Thailand, Turkey and Venezuela.. The FTSE NAREIT Equity REITs Index is an index of publicly traded REITs that own commercial property. All tax-qualifies REITs with common shares traded on the NYSE, AMSE or NASDAQ National Market List will be eligible. Additionally, each company must be valued at more than $100MM USD at the date of the annual review. Equity REITs include Diversified, Health Care, Self Storage, Industrial/Office, Residential, Retail, Lodging/Resorts and Specialty. They do not include Hybrid REITs, Mortgage Home Financing or Mortgage Commercial Financing REITs. Bloomberg Sub Gold TR USD Description unavailable. Formerly known as Dow Jones-UBS Gold Subindex (DJUBSGC), the index is a commodity group sub-index of the Bloomberg CI composed of futures contracts on Gold. It reflects the return of underlying commodity futures price movements only and is quoted in USD.