Reality Check

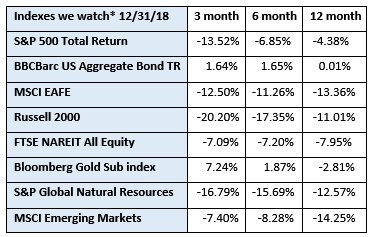
The 4th quarter of 2018 was a brutal reminder of the inevitably uncertain nature of the equity markets. 2018 was shaping up to be another good year for US stocks. We were poised for ten straight years of the S&P 500 Total Return Index recording positive annual gains, which had never happened before. The Fed remarked that these were ‘extraordinary times’. Then the bottom fell out. The S&P 500 dropped 13.52% in the 4th quarter. Streak ended.
We don’t like to see negative returns but are not surprised when they occur. It is a by-product of an efficient stock market. Things like tariffs, wild-fires, hurricanes, rising interest rates, government shutdowns and tax cuts should have some impact on the market, whether good or bad. After all, at the basic level, a stock traded on an exchange should be valued on its projected ability to generate a positive return over time. Product costs, wages, technology, health care benefits, supply and demand – these variables all impact the ability of a company to deliver sustained value to its shareholders. Group these companies together and these factors influence the overall value of the stock market. A market that only goes in one direction just doesn’t make sense. We don’t all get participation trophies for investing.
At Bryant & Brannock, we attempt to mitigate the impact of inevitable downturns by investing across a diverse set of asset classes. In December of this past year, almost every asset class dropped in value, but as shown in the chart above, the Gold and Bond indexes had positive returns for the quarter. It wasn’t enough to keep our portfolios above water, but it provided some relief amidst the downturn.
Diversification is not strictly reserved for mitigating risk, though. We cast a wide net to capture the opportunity to participate in oversize gains when they occur, as well. Over the past several years, the US equity markets have consistently outperformed most international markets. Historically, this is not the case. We would not be surprised to see other markets start to outperform our domestic market, especially if the phase of tightening monetary policy continues here at home.
On a happier note, we quietly celebrated our tenth anniversary in 2018. Our firm began as Bryant Investment Management Group in 2008, a year better known for its tumultuous decline in the stock markets. We cherish the relationships we have formed over the years, and we sincerely appreciate your continued trust and confidence.
*The index returns are drawn from Morningstar Advisor Workstation. Indexes are unmanaged and cannot be invested in directly by investors. MSCI EAFE NR USD-This Europe, Australasia, and Far East index is a market-capitalization-weighted index of 21 non-U.S., industrialized country indexes. S&P 500 TR USD – A market capitalization-weighted index composed of the 500 most widely held stocks whose assets and/or revenues are based in the US; it’s often used as a proxy for the stock market. TR (Total Return) indexes include daily reinvestment of dividends. Bloomberg US Agg Bond TR USD This index is composed of the BarCap Government/Credit Index, the Mortgage Backed Securities Index, and the Asset-Backed Securities Index. The returns we publish for the index are total returns, which includes the daily reinvestment of dividends. The constituents displayed for this index are from the following proxy: iShares Core US Aggregate Bond ETF. MSCI Emerging Markets IndexSM is a free float-adjusted market capitalization index that is designed to measure equity market performance in the global emerging markets. Russell 2000 – Consists of the smallest 2000 companies in the Russell 3000 Index, representing approximately 7% of the Russell 3000 total market capitalization. The returns we publish for the index are total returns, which include reinvestment of dividends. The MSCI Emerging Markets (EM) IndexSM is a free float-adjusted market capitalization index that is designed to measure equity market performance in the global emerging markets. As of May 2005 the MSCI Emerging Markets Index consisted of the following 26 emerging market country indices: Argentina, Brazil, Chile, China, Colombia, Czech Republic, Egypt, Hungary, India, Indonesia, Israel, Jordan, Korea, Malaysia, Mexico, Morocco, Pakistan, Peru, Philippines, Poland, Russia, South Africa, Taiwan, Thailand, Turkey and Venezuela.. The FTSE NAREIT Equity REITs Index is an index of publicly traded REITs that own commercial property. All tax-qualifies REITs with common shares traded on the NYSE, AMSE or NASDAQ National Market List will be eligible. Additionally, each company must be valued at more than $100MM USD at the date of the annual review. Equity REITs include Diversified, Health Care, Self Storage, Industrial/Office, Residential, Retail, Lodging/Resorts and Specialty. They do not include Hybrid REITs, Mortgage Home Financing or Mortgage Commercial Financing REITs. Bloomberg Sub Gold TR USD Description unavailable. Formerly known as Dow Jones-UBS Gold Subindex (DJUBSGC), the index is a commodity group sub-index of the Bloomberg CI composed of futures contracts on Gold. It reflects the return of underlying commodity futures price movements only and is quoted in USD.
