Finding Firm Footing
Congratulations to Spain for winning the FIFA World Cup! The entire tournament seemed like a celebration, didn’t it? The whole world came together in a way that rarely happens anymore. Mobs of people gathered in the streets cheering their teams, rather than protesting their grievances. Political parties momentarily took a back seat to pre-game parties, watch parties and post-game parties. We also discovered that the world apparently has an insatiable appetite for beer and Ranch dressing.
But time marches on, and the euphoria of the tournament fades into a fond memory. Geopolitics move back to the forefront, cease-fires falter, and drones and missiles replace fireworks in the sky. The US economy is looking for firm footing. Consumers are spending freely, even as the personal savings rate is reported as being at decades-long lows. The annual rate of inflation is 3.5%, well above the Federal Reserve’s target of 2%. Mortgage rates are hovering around 6.5%. The unemployment rate is 4.2%, which is on the low side of normal, typically between 4-5%. Credit card debt is up nearly 6% compared to a year ago. Gas prices have been up and down but are significantly higher than before the war in Iran started. The economic numbers present kind of a mixed bag. Things feel … iffy.
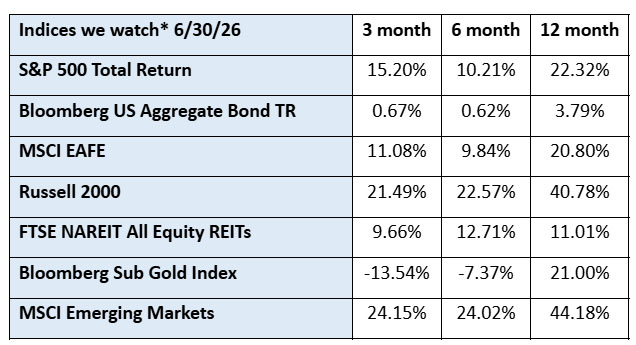
The chart of indices above shows that the various markets continue to do very well, other than gold, which is getting a well-deserved rest. The strength of the market seems largely driven by optimism concerning Artificial Intelligence. Companies have spent massively on chips, software and data centers. There is an expectation that this outpouring of cash will result in increased productivity and profitability, but the timeline for the payoff is only a guess at this point. Are we headed towards a boom or a bust?
We are not throwing up a red card at this point. We believe there is reason for concern, and reason for optimism. We think it is wise to diversify your portfolio to help mitigate risk while simultaneously positioning yourself for potential reward. Emerging market stocks, and small and mid-cap stocks, outperformed the S&P 500 again this quarter, and over the trailing 12 months. Bonds held steady, and real estate firmed up.
**The index returns are drawn from Morningstar Advisor Workstation. Indexes are unmanaged and cannot be invested in directly by investors. MSCI EAFE NR USD-This Europe, Australasia, and Far East index is a market-capitalization-weighted index of 21 non-U.S., industrialized country indexes. S&P 500 TR USD – A market capitalization-weighted index composed of the 500 most widely held stocks whose assets and/or revenues are based in the US; it’s often used as a proxy for the stock market. TR (Total Return) indexes include daily reinvestment of dividends. Bloomberg US Agg Bond TR USD This index is composed of the BarCap Government/Credit Index, the Mortgage Backed Securities Index, and the Asset-Backed Securities Index. The returns we publish for the index are total returns, which includes the daily reinvestment of dividends. The constituents displayed for this index are from the following proxy: iShares Core US Aggregate Bond ETF. MSCI Emerging Markets IndexSM is a free float-adjusted market capitalization index that is designed to measure equity market performance in the global emerging markets. Russell 2000 – Consists of the smallest 2000 companies in the Russell 3000 Index, representing approximately 7% of the Russell 3000 total market capitalization. The returns we publish for the index are total returns, which include reinvestment of dividends. The MSCI Emerging Markets (EM) IndexSM is a free float-adjusted market capitalization index that is designed to measure equity market performance in the global emerging markets. As of May 2005 the MSCI Emerging Markets Index consisted of the following 26 emerging market country indices: Argentina, Brazil, Chile, China, Colombia, Czech Republic, Egypt, Hungary, India, Indonesia, Israel, Jordan, Korea, Malaysia, Mexico, Morocco, Pakistan, Peru, Philippines, Poland, Russia, South Africa, Taiwan, Thailand, Turkey and Venezuela.. The FTSE NAREIT Equity REITs Index is an index of publicly traded REITs that own commercial property. All tax-qualifies REITs with common shares traded on the NYSE, AMSE or NASDAQ National Market List will be eligible. Additionally, each company must be valued at more than $100MM USD at the date of the annual review. Equity REITs include Diversified, Health Care, Self Storage, Industrial/Office, Residential, Retail, Lodging/Resorts and Specialty. They do not include Hybrid REITs, Mortgage Home Financing or Mortgage Commercial Financing REITs. Bloomberg Sub Gold TR USD Description unavailable. Formerly known as Dow Jones-UBS Gold Subindex (DJUBSGC), the index is a commodity group sub-index of the Bloomberg CI composed of futures contracts on Gold. It reflects the return of underlying commodity futures price movements only and is quoted in USD.