RIP 2025
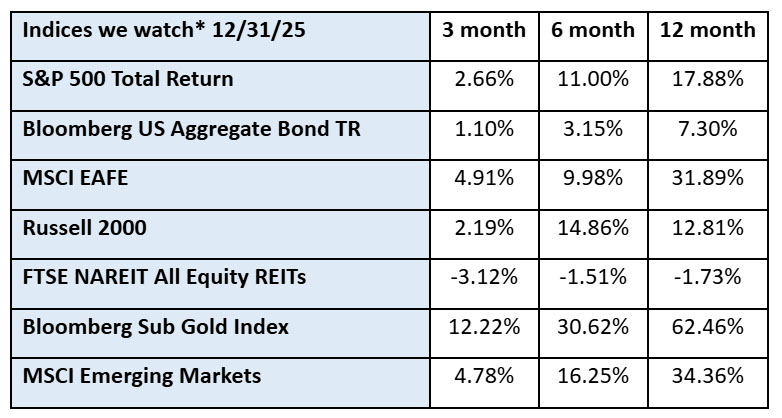
We at Bryant & Brannock miss 2025 already. It was a tumultuous year in many respects, but it delivered a steady supply of positive returns across a broad range of asset classes. Global real estate was one of the only sectors that was negative for the year, and it was down by less than 2%. US domestic equities, both large and small cap, were up by double digits. International equities, both developed and emerging markets, were up even more than US equities. The Bond markets had another good year, and gold – the ‘safe-haven’ asset – was up an astonishing 62%. 2025 was a very good year to be invested.
That isn’t to say that it was a smooth ride. There were plenty of periods of uncertainty and volatility. Wars. Tariffs. Interest rates. Tik-Tok. China. Government shutdowns. Protests. Inflation fears. Affordability issues. Immigration. Global tensions. There were many opportunities to derail the markets in 2025, but the consumer kept showing up, kept spending and the markets continued to set record highs throughout the year.
After three tumultuous weeks to start the new year, it looks like 2026 is trying to outdo 2025 in terms of sheer audacity. The question going forward is whether or not the consumer is going to continue to show up and spend money on goods to keep this economy rolling. If they do, this could be another great year for the markets. If they don’t, well, we will miss 2025 all the more.
**The index returns are drawn from Morningstar Advisor Workstation. Indexes are unmanaged and cannot be invested in directly by investors. MSCI EAFE NR USD-This Europe, Australasia, and Far East index is a market-capitalization-weighted index of 21 non-U.S., industrialized country indexes. S&P 500 TR USD – A market capitalization-weighted index composed of the 500 most widely held stocks whose assets and/or revenues are based in the US; it’s often used as a proxy for the stock market. TR (Total Return) indexes include daily reinvestment of dividends. Bloomberg US Agg Bond TR USD This index is composed of the BarCap Government/Credit Index, the Mortgage Backed Securities Index, and the Asset-Backed Securities Index. The returns we publish for the index are total returns, which includes the daily reinvestment of dividends. The constituents displayed for this index are from the following proxy: iShares Core US Aggregate Bond ETF. MSCI Emerging Markets IndexSM is a free float-adjusted market capitalization index that is designed to measure equity market performance in the global emerging markets. Russell 2000 – Consists of the smallest 2000 companies in the Russell 3000 Index, representing approximately 7% of the Russell 3000 total market capitalization. The returns we publish for the index are total returns, which include reinvestment of dividends. The MSCI Emerging Markets (EM) IndexSM is a free float-adjusted market capitalization index that is designed to measure equity market performance in the global emerging markets. As of May 2005 the MSCI Emerging Markets Index consisted of the following 26 emerging market country indices: Argentina, Brazil, Chile, China, Colombia, Czech Republic, Egypt, Hungary, India, Indonesia, Israel, Jordan, Korea, Malaysia, Mexico, Morocco, Pakistan, Peru, Philippines, Poland, Russia, South Africa, Taiwan, Thailand, Turkey and Venezuela.. The FTSE NAREIT Equity REITs Index is an index of publicly traded REITs that own commercial property. All tax-qualifies REITs with common shares traded on the NYSE, AMSE or NASDAQ National Market List will be eligible. Additionally, each company must be valued at more than $100MM USD at the date of the annual review. Equity REITs include Diversified, Health Care, Self Storage, Industrial/Office, Residential, Retail, Lodging/Resorts and Specialty. They do not include Hybrid REITs, Mortgage Home Financing or Mortgage Commercial Financing REITs. Bloomberg Sub Gold TR USD Description unavailable. Formerly known as Dow Jones-UBS Gold Subindex (DJUBSGC), the index is a commodity group sub-index of the Bloomberg CI composed of futures contracts on Gold. It reflects the return of underlying commodity futures price movements only and is quoted in USD.